Operations / Utilization
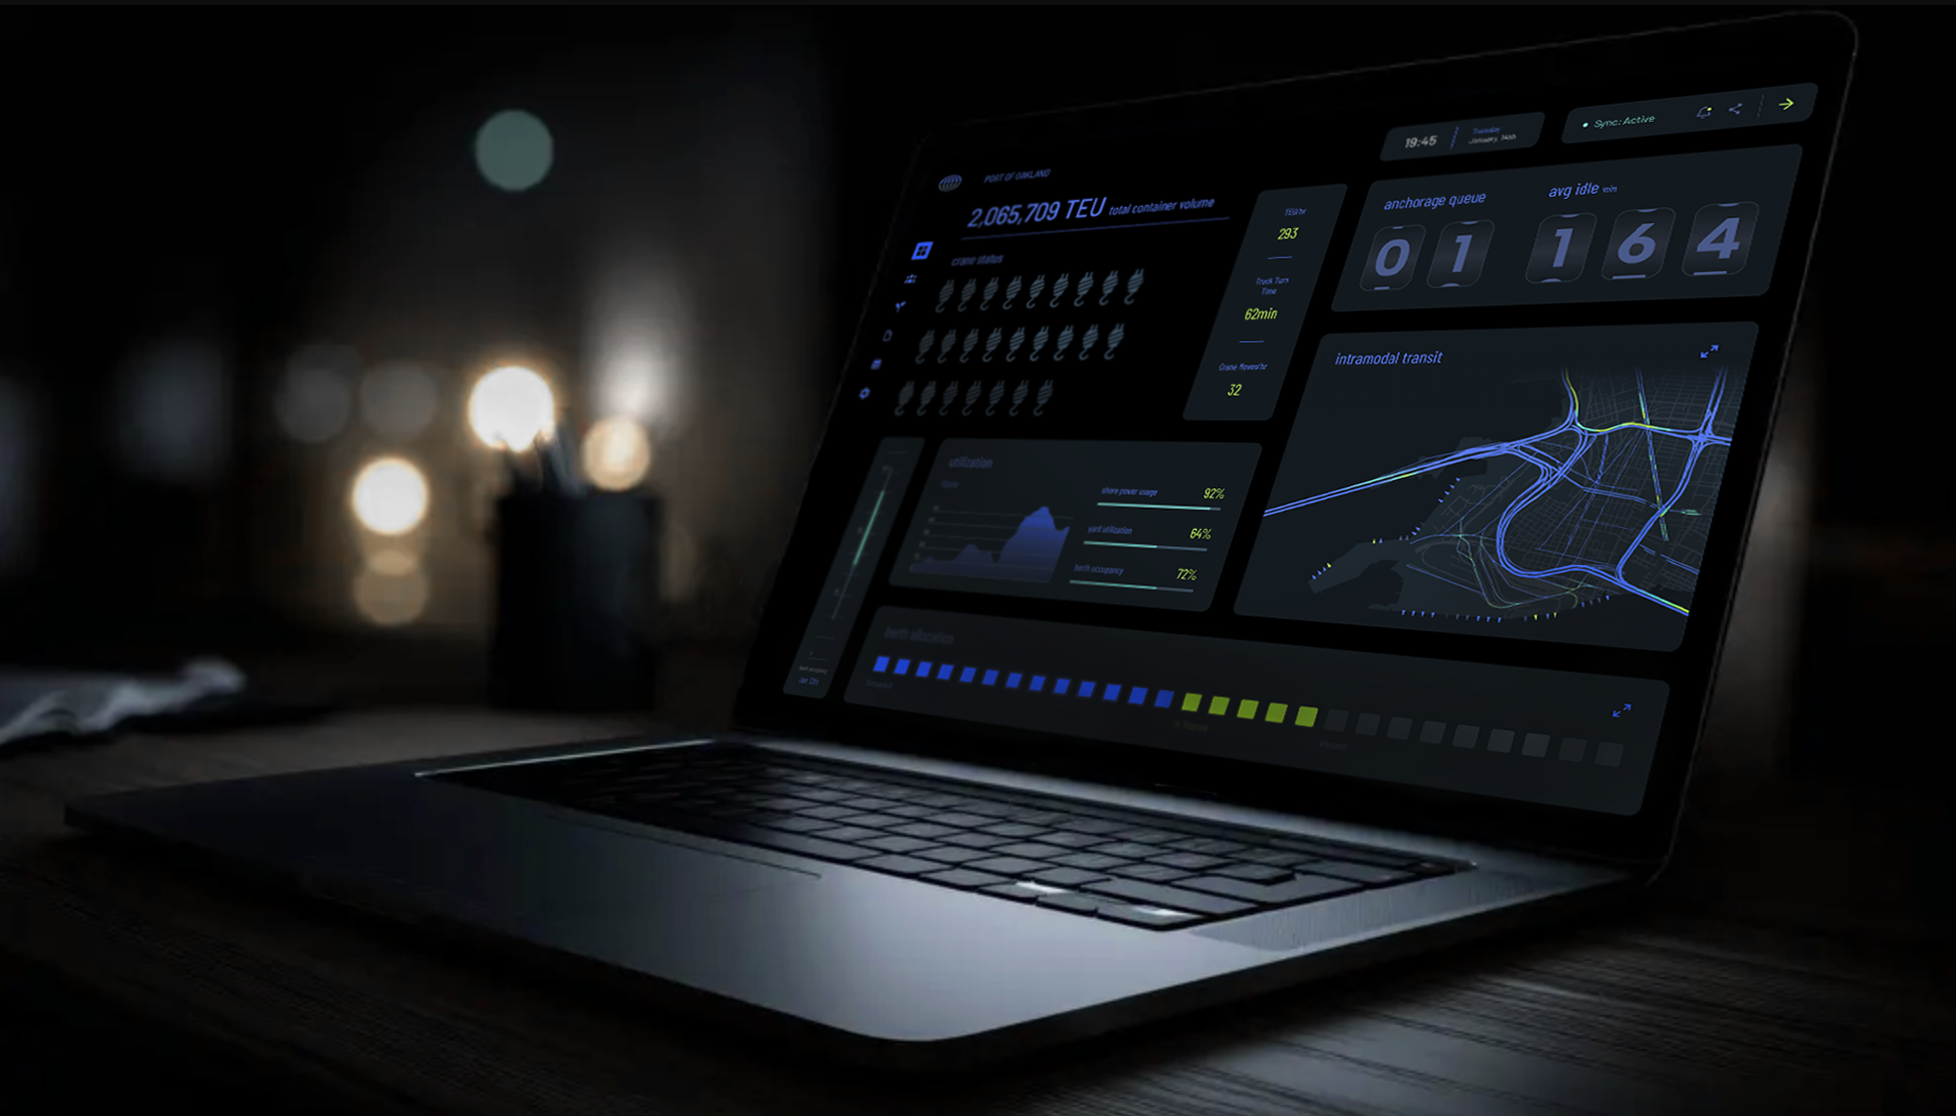
This project explores the design of a real-time Port Operations & Utilization Dashboard built to support decision-making across berth activity, vessel traffic, and landside congestion.
The goal was to simplify a complex operational environment - where marine, terminal, and logistics data converge - into a clear, intuitive interface. Through mapping, live status indicators, and capacity-based metrics, the dashboard provides a unified view of port health, enabling faster insights and more efficient resource use.
Port operations are highly complex, with thousands of containers, vessels, trucks, and pieces of equipment moving through tightly scheduled, space-constrained terminals every day. Even small delays, such as an early vessel arrival or a surge of truck traffic, can ripple across the system, slowing throughput and increasing operational costs.
With so many variables shifting in real time, operators need a clear, consolidated view of what’s happening across berths, yards, gates, and surrounding roads. A real-time utilization dashboard brings these moving parts into a single, actionable picture, helping teams anticipate congestion, allocate resources efficiently, and make faster, more confident decisions in a dynamic environment.
Background
Key Benefits
Real-Time Monitoring and Alerts
Improved Efficiency and Resource Allocation
Scalability
Data visualization transforms complex datasets into an easy-to-understand overview - letting the user deep dive into focus areas as their role and individual uses require.
Targeted Results
Reduction in Port Congestion
Lowered Response Times
Investing in real-time analytics offers the opportunity for increased efficiency, cost savings, and improved operational performance.
Design Background Coming Soon
Check back for the project details